Flood risk at the end of summer and in autumn: what climate change actually tells us
8 min read
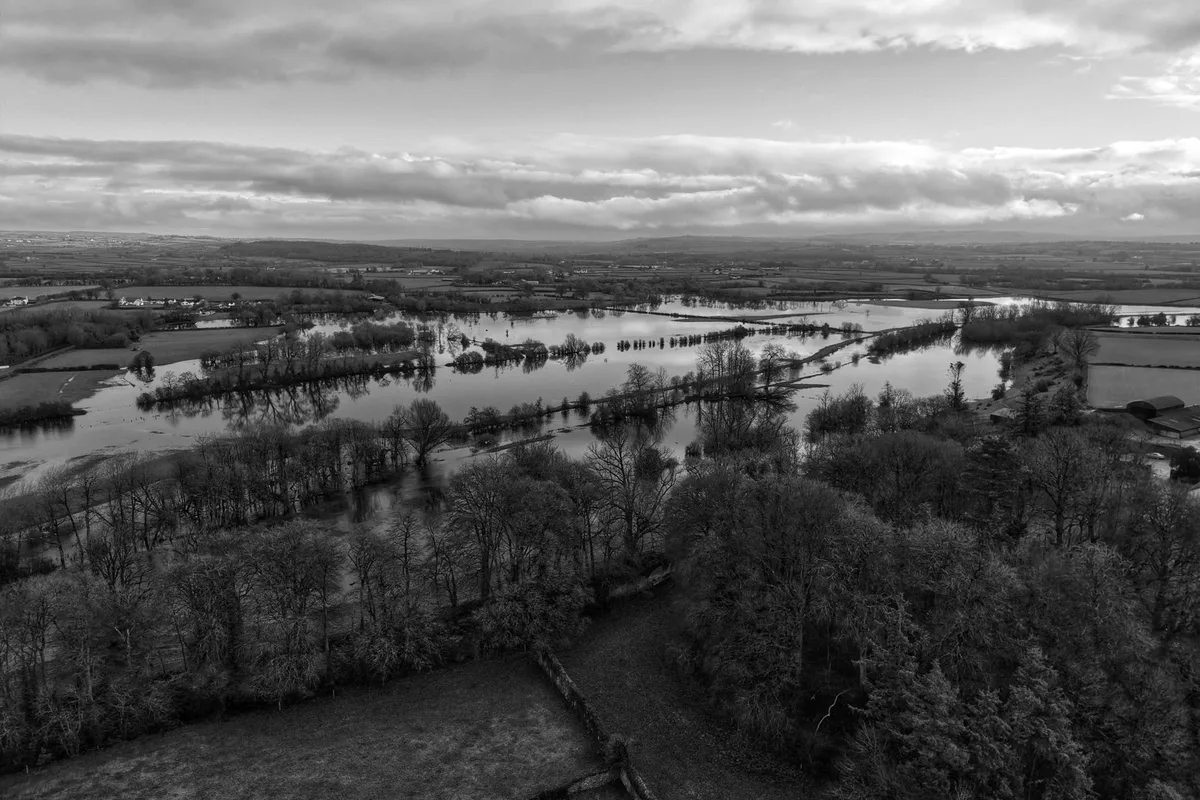
Late August, a logistics warehouse close to the Secchia, just downstream of Modena. The site manager looks at the loading yard and asks a practical question: is it inside the “golena” (the strip of land between the river and the main embankment) — the ground that floods first — or outside it? The answer does not live in one place. The floodplain’s boundary belongs to AIPo, the Po river-works agency. The flood scenario the law calls P2 or P3 belongs to the Po river basin district authority. The river level during the storm that kept everyone on edge last September sits in Arpae’s archive, if someone saved it before the live feed overwrote it. What actually happened that evening sits in an internal email, never attached to the site’s file.
What is already measured
ISPRA’s report 415/2025 on hydrogeological instability, 2024 edition, counts 94.5% of Italian municipalities — 7,463 out of the total — at risk from landslides, floods, avalanches and/or coastal erosion, and 6.8 million residents in areas of medium flood hazard (2024 data). These are exposure figures — how many people sit inside maps already drawn — not a forecast.
For Emilia-Romagna the report is specific. Two closely spaced rainfall events in May 2023 triggered more than 80,000 landslides; the regional commission that assessed how exceptional the event was (Brath et al., 2023) found that rainfall to be the historical maximum daily areal rainfall for the Romagna river basins between the Senio and the Ronco, and the regional administration, through Arpae, put that year’s combined flood-and-landslide damage at €8.6 billion. ISPRA places that event — alongside one in September 2024 in Emilia-Romagna and one in September 2022 in the Marche — among the examples of the kind of change, in intensity, duration and frequency, that climate change can bring to weather phenomena. That is not a formal attribution of the single event, a discipline we have not applied: it is the frame ISPRA uses to introduce what the Floods Directive requires be considered at every review.
2025, across Europe, was not a year of extensive flooding: the Copernicus-ECMWF state-of-the-climate report records that the extent of the European river network affected by flooding was the second lowest of the 33-year observed record, with 12% of rivers above the high threshold and 5% above the severe one. Yet in April 2025, the same report notes, intense rainfall over northern and central Italy still caused “widespread flooding and landslides”, with evacuations from floodplains. A quiet year on the European average was not quiet everywhere: the first distinction worth keeping.
What is projected, and at what confidence
Here the language matters as much as the data. The Sixth Assessment Report’s Regional Fact Sheet for Europe projects the increase in extreme precipitation and pluvial flooding — surface-water flooding, not river flooding — “in all regions except the Mediterranean” above 1.5°C of warming, at “high confidence”: in the IPCC’s calibrated system, high confidence signals strong agreement across multiple lines of evidence — observations, models, physical understanding — not certainty about the outcome. The Mediterranean, Italy included, is the declared exception to that projection, not an automatic extension of it.
On river flooding the IPCC is more cautious everywhere: Chapter 11 states that “regional changes in river floods are more uncertain than changes in pluvial floods”, because complex hydrological processes — land use, water management — come into play that rainfall statistics alone do not capture. For Western and Central Europe the fact sheet still records an “observed increasing trend in river flooding”, with a further increase projected above 2°C (high confidence); for Northern and Eastern Europe, by contrast, a projected decrease (medium confidence). For the Mediterranean, on river flooding, there is no entry at all: only drought, aridity and fire weather — a declared absence, not an implicit verdict of zero risk. The European Environment Agency, in plainer, uncalibrated language, goes further: pluvial and fluvial flooding “are already creating substantial risks for the built environment and population across Europe”, with “Further increases in flood risk are projected for the future”.
Why autumn specifically
The seasonality is not itself a symptom of a changing climate: it is the physics of the Mediterranean basin, documented in peer-reviewed literature long before the topic reached the newspapers. A review from the HyMeX programme on heavy precipitation in the western Mediterranean (Khodayar et al., 2021, Atmospheric Chemistry and Physics) explains that in late summer the sea is still warm — a source of heat and moisture — while the coastal terrain triggers convection: the combination produces accumulations exceeding 100–150 mm in a few hours, from near-stationary convective systems. These are, by mortality, among the most dangerous weather hazards in the Mediterranean, with damage running into hundreds of millions of euros every year, the same review says — adding that despite the overall drying expected for the Mediterranean climate, the intensity of these events is expected to increase: a synthesis of several modelling studies it cites, not a measurement.
A map pegged to a cycle still open
The maps our river territory tool shows — the P1/P2/P3 scenarios of the current flood risk management plan (the PGRA), the floodplains and AIPo’s embankments — are not a snapshot of today: they are the output of the last closed cycle of the Floods Directive, data going back to ISPRA reports 353 and 356 of 2021. The third cycle (2022–2027) called for hazard maps to be updated by December 2025; as of the latest ISPRA report available, that national update was still «in corso di costruzione» (still under construction). Knowing which freeze-frame the mapping an emergency plan is pegged to actually corresponds to — with a date and a version — is part of the proof, not a detail.
The same hydrometric thresholds that classify a flood — above threshold 1, the low-flow channel fills; above 2, the floodplains; above 3, the whole cross-section, close to historical highs, as Arpae’s own guide to the level map defines them — are not in the open data our tool draws on: which is why the stations stay neutral, as we already state on the page. Same problem, smaller scale: the institutional figure exists, just not in a format that lets it be cross-checked automatically with the rest.
Anyone renewing catastrophe cover finds the same problem tighter still: floods and landslides sit outside the nationally checkable calculation, because the hazard polygons change scale and vintage from one river-basin authority to the next. On the Secchia-Panaro-Po stretch, our tool fills exactly that gap, cross-referencing the current scenario with the level read every fifteen minutes from 280 Arpae-SIMC stations.
Where we stop
We have neither carried out nor found a formal attribution study for the individual events cited: a distinct discipline, with its own method. We do not know whether the map update, due by December 2025, has since been completed: the latest ISPRA report we read still had it in progress. We have not verified exactly which IPCC sub-region the Po basin falls under, and so we do not attribute a sub-region-specific European projection to the Secchia or the Panaro. Where Italian literature (CMCC) appeared to offer a seasonal autumn figure, we could not trace it back to a primary source within the limits of this research, and so we do not report it.
The two axes, applied
Complying. Article 14 of the Floods Directive requires that, at every cycle, the impacts of climate change on flood occurrence be taken into account: in our system that becomes a control that records, for every client site, the version and date of the PGRA mapping an emergency plan is pegged to — and flags on its own when that version changes, instead of waiting for the next inspection or the next policy renewal.
Deciding. Hazard maps, river levels, site emergency plans and records of past events become a single operating model, on which AI agents watch every site against its nearest river and alert an operator when the level moves — not in place of official civil-protection alerts, but before the question comes from an insurer or an inspector. For manufacturing, logistics and public administration, always in two modes: on-premises on autonomous machines within the client’s perimeter, or dedicated cloud with a data centre in Italy — always with shared management.
Do you have sites near a watercourse, with autumn approaching? Half an hour with one of our engineers, at no cost: we start from the current map and from what your site can already prove.
Sources
- IPCC AR6 WGI — Regional Fact Sheet, Europe
- IPCC AR6 WGI — Chapter 11, Weather and Climate Extreme Events in a Changing Climate
- Copernicus/ECMWF — European State of the Climate 2025 (full report, PDF)
- EEA — European Climate Risk Assessment (EUCRA), Report 01/2024
- ISPRA — Report 415/2025, Hydrogeological instability in Italy: hazard and risk indicators, 2024 edition
- Arpae Emilia-Romagna — Guide to the map: hydrometric levels
- Khodayar et al., 2021 — Mechanisms leading to heavy precipitation in the western Mediterranean: lessons from HyMeX, Atmospheric Chemistry and Physics
- CSIDIA — river territory tool